The History page provides advanced features to explore and analyse datasets recorded by Port-Log.
The History page generally requires authentication to "User" level privileges or higher. Please contact OceanWise directly, or your Port-Log administrator, if you require this functionality for your login or for your system.
Depending on the system version, some of the sub-pages highlighted in the History section may or may not be available. If you would like further infomation on adding any of these pages to your system, please contact OceanWise directly to discuss system upgrades.
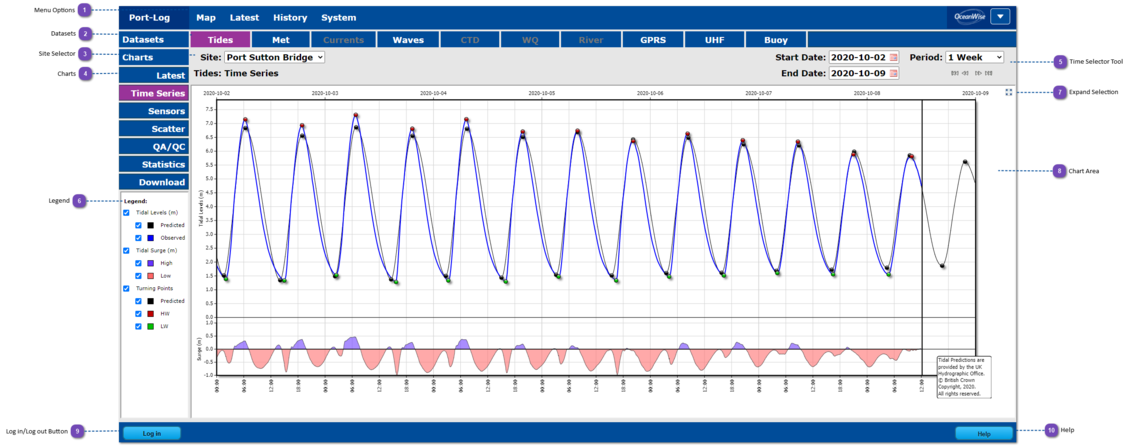
Menu Options
This menu allows the user to switch between the Map, Latest and History pages for viewing the data. To access the System pages, the user must have permissions to a level of "Admin" granted.
Selecting History takes the user to the first detailed page - generally the first tidal site within the system, listed alphabetically.
Datasets
All available parameters within the system will be shown here - if a paramater has an active site/sensor, the parameter header will be coloured white. If the parameter is unavailable, the parameter will be shaded grey.
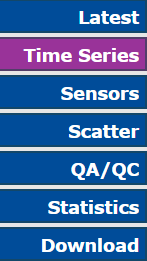
Time Series - graph showing observed and predicted data for the user-defined period and selected dataset.
Sensors - graph showing raw sensor output for the user-defined period and selected dataset. This may include parameters:
External Power Status
Battery Voltage
Pressure (bar)
Radar Range
Intruder Switch Status
Other (raw) sensor data - depending on the type of dataset selected and sensor type installed.
Scatter - generates a scatter plot of parameters available for the site, as an XY relationship.
QA/QC - allows the user to view the current data quality parameters, such as Rate of Change (per min) and Standard Deviation, and apply variants of these to the data, for data cleaning purposes.
Statistics - generates a report based on the selected site and time period including stats on the raw data, oceanography, tidal turning points and the return percentage of each parameter.
Download - produces text output of all parameters associated with the selected dataset and to the user-defined time period, in a variety of predefined formats. The output can be copied and saved into a local file for further analysis.
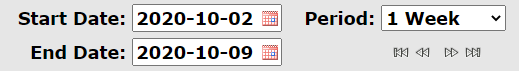
Here, the user can select a period of time of interest, stretching from latest through to monthly data. The two time boxes (Start and End Date) pop-out as interactive calendars, whilst the Period selector is a drop-down menu with the varying time-frames available.
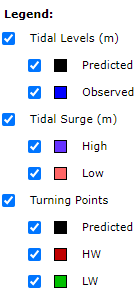
To the left of the main graph, a Legend shows all plotted paramaters. In most cases, the Legend is interactive, and paramaters can be switched on or off by checking the tick box next to the paramater name.
With all Port-Log graphs, the graph can be expanded by selecting this button. This opens the graph in either a pop-out or page of its own, for the purposes of printing, for example.
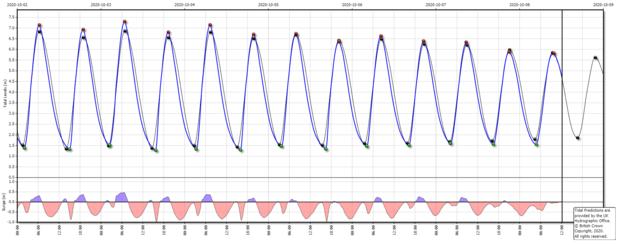
The main chart area will display a chart of the user's choosing - based upon the paramater selected from the horizontal Datasets menu, and the subsequent Site and Time Period. In this instance, a tidal time-series is displayed, over a 7-day period. Observed tides are plotted in blue, with predicted tides plotted in black. A surge/cut timeseries is also displayed at the base, with shaded red (cut) and blue (surge) periods highlighted.