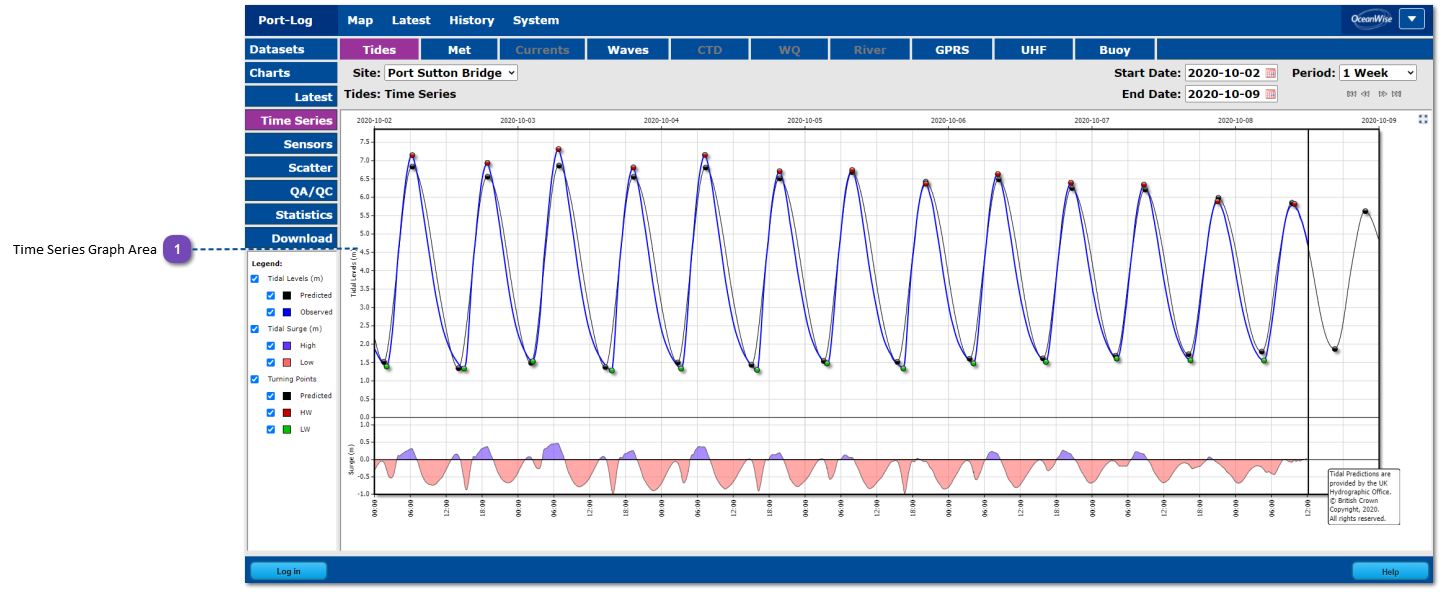
This is an example showing how "Time Series" data are displayed within the History pages.
Time Series Graph Area
The data are drawn in the main window. For graph data like the "Time Series" data shown here each paramater is plotted as a separate line within the chart area. For more information on the tide-specific graphs and their different components, see here.