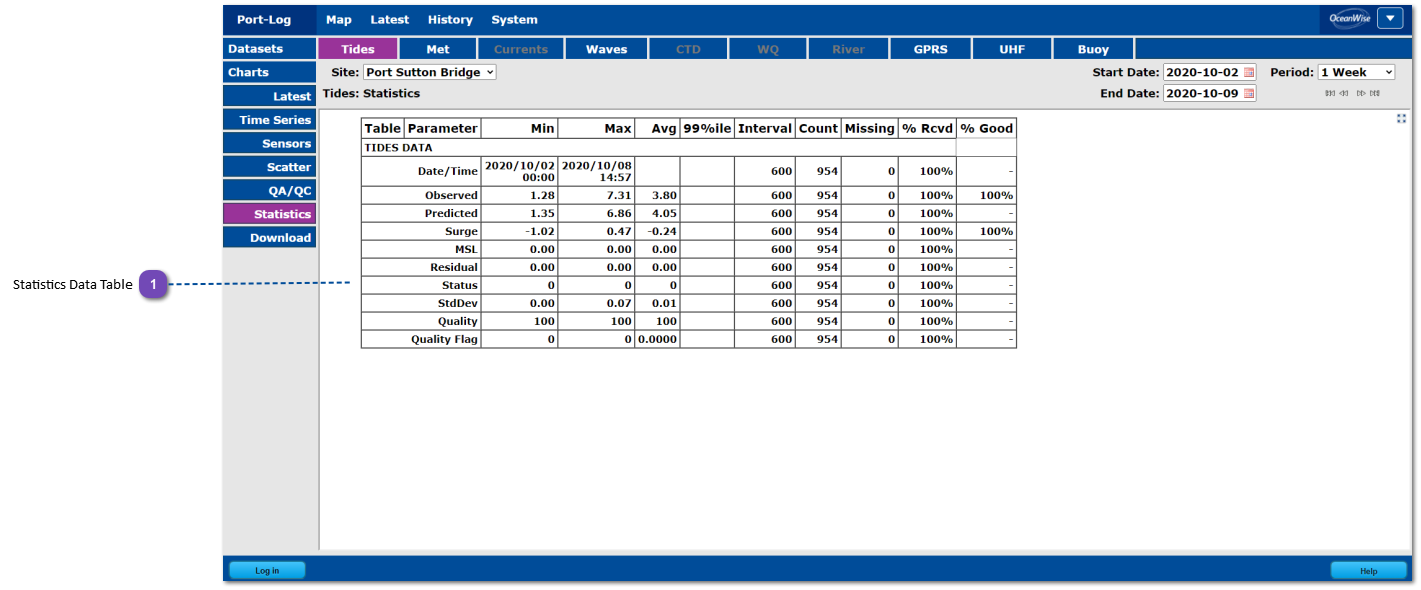
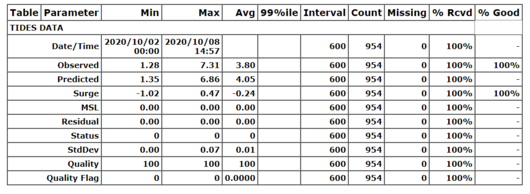
This is an example showing how "Statistics" are displayed within the History pages. In the same way as with the other pages within the History cluster, the user can change the Site and Time Limits, using drop-down menus just above the Statistics Data Table.
Statistics Data Table
The data are drawn in the main window. For tabular data like the "Statistics" data shown here a table can only be produced if the site selected is an environmental monitoring sensor and not an out station, base station or other intermediary device (ie, not the telelmetry device).