This is an example showing how "Sensors" data are displayed within the History pages.
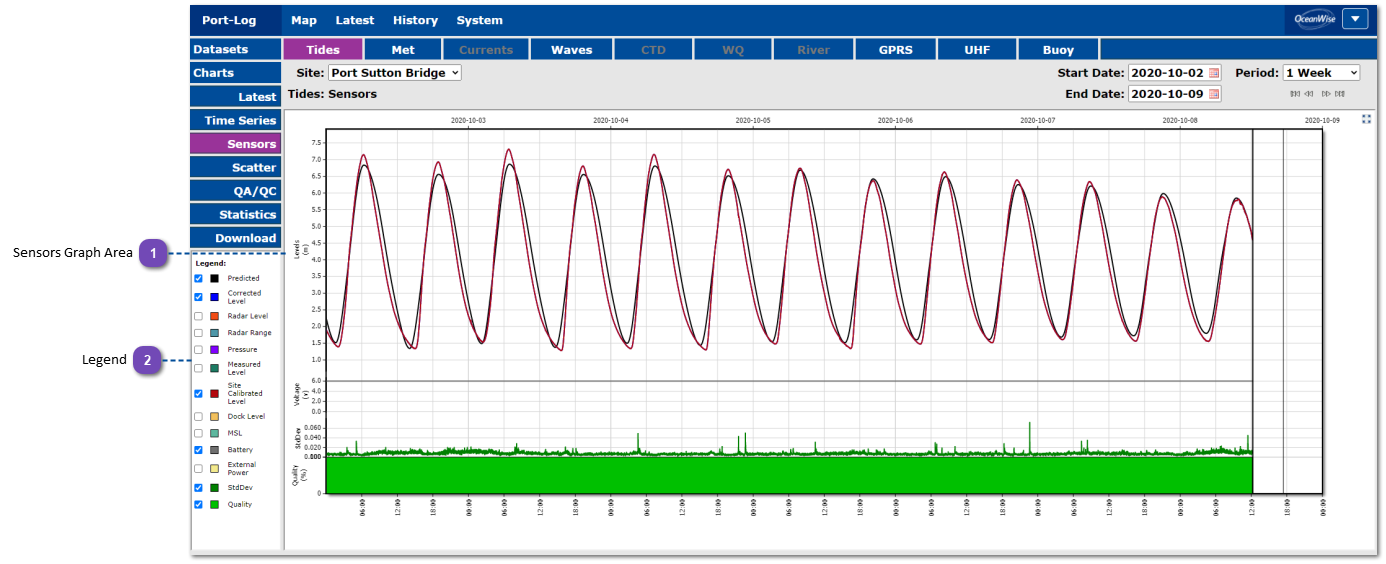
This is an example showing how "Sensors" data are shown within the Advanced Graphs page. Note that a child/parent relationship is maintained between Sensors, Enclosures and Base Stations so that if a Base Station is chosen as a Site, the child enclosures and sensors are reported together in the graph output.
Sensors Graph Area
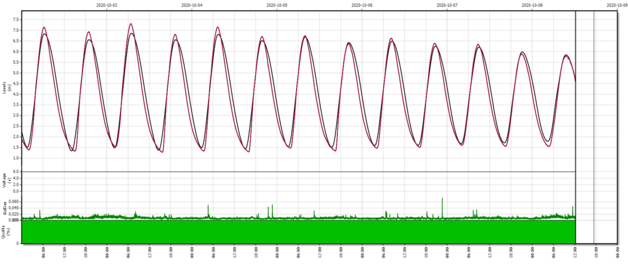
The data are drawn in the main window. For graphical data like the "Sensors" data shown here, each paramater is represented as a separate plot on the same graph. Sub-plots may be available at the base of the graph, such as are shown here - Quality (%) and Standard Deviation.
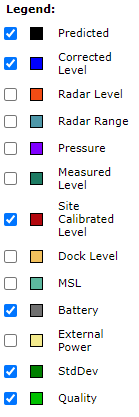
The Legend shows all paramaters which can be displayed on the Sensors plot. Paramaters can be made visible/hidden by checking or unchecking the tick-boxes next to the paramater name.