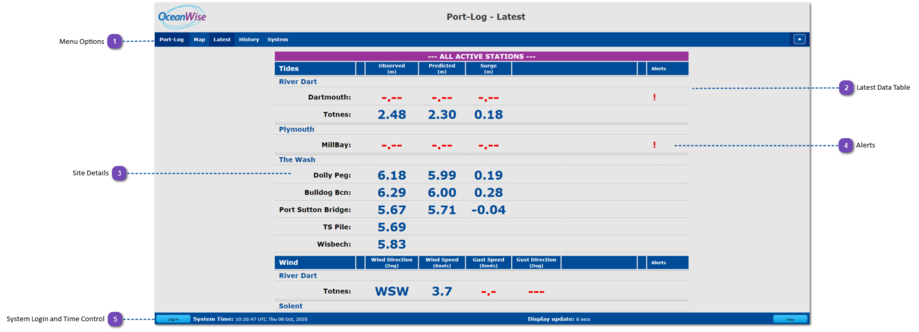
This page displays the most recent records from all of the sensors deployed in the system.
Authentication can be enabled at various levels in the system. This page can be either publicly accessible or hidden behind a login.
Understanding the "Latest" display screen
Which sensors are displayed
Individual sites and sensors are selected in the display configuration page to make them visible or hidden from the "Latest" page.
The page will display any sensors which are "Active" within the display configuration page.
Structure of the Latest display
In the footer at the base of the screen there are two timer controls.
The first displays the system time as stored by the server. This will be represented in either UTC or a local time zone depending on system configuration.
The second is a count down timer which indicates the number of seconds until the display window is refreshed. When the counter expires the Port-Log database will provide the latest set of sensor records to the web display. Depending on the sample frequency of the sensors, the latest data record may not change with every refresh of the web display.
If the display refresh is successful the updated gauge data will be displayed immediately and the count down counter will reset, otherwise several attempts will be made to re-issue the instruction to the server whilst the count down displays the message "updating...". If a connection is still not established or the database query fails to respond the gauge table will clear and a diagnostics error message will appear, the count down timer will display the message "FAILED". During this time the web page will continue to attempt to reconnect to the server indefinitely and the count down timer will show each attempt with the "updating..." message.
As a precaution against web-browser cache limitations and script performance over extended duration the entire gauge display web page will refresh every 10 minutes.
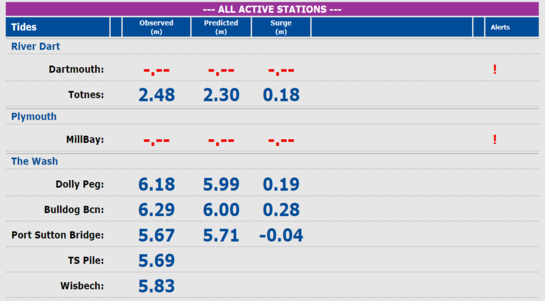
The Latest data display can contain many different types of data. For this reason there is a separate data table for data arriving from different sensor types. The column size is controlled automatically based on content size and screen size. To have some control over the appearance of the table use the zoom controls within the web browser to change the size of data within the tables (CTRL + or CTRL - in most browsers).
How is data validated
So that the Latest display table is always showing the most up to date and reliable data there are a number of indicators in place to warn of a drop in data validity.
The two parameters that are monitored are Time and Quality. The indicators operate in an order of priority so that a simple colour coded warning system can operate as follows:
|
Data Validation Scenario
|
Formatting applied
|
Example
|
|
0 - Data is valid
|
Data values coloured Blue
|
2.15
|
|
1 - Data has quality or time issues
|
Data values are coloured Amber
|
2.15
|
|
2 - Data has an Age greater than the defined warning interval
|
Data values are coloured Red
|
2.15
|
|
3 - Data has an Age greater than the defined timeout interval
|
Data blanked out and coloured Red
|
-.--
|
The order of priority operates as per the table above, therefore if the latest data has an age that is greater than the "warning interval" it will be coloured red regardless of the presence of a quality warning or not.
Should a quality warning exist, an active alert will be in place and an exclamation mark (either amber or red) will show in the Alerts column. Futhermore should one of the telemetry systems fail to provide data within the defined timeout interval an active alert will be generated even if the secondary telemetry system (if fitted) is providing a current and valid data record. This means that it is possible to see a valid data record that has been received via the primary telemetry method with an alert warning that the secondary telemetry method has received no data within the timeout interval.
The Alerts column will show a description of any quality or timeout alerts that exist on the current record. Clicking the alert icon will take the user to the alerts page for full information on alerts to the selected sensor, and the whole system.
For more information about alerts see the Alerts help page.
 Menu OptionsIndicates the Latest page is selected. To configure which sensors are on display select the "System" button.
|
|
 Latest Data TableContains the latest data records. Click the sensor name to go to a page of full details including graphical data for the sensor in question.
|
|
 Site DetailsClick on a sensor name to open a detailed page of data-series for the site or sensor in question.
|
|
 AlertsAlerts regarding the quality or the age of the data values being supplied by the sensor are indicated with the exclamation mark and the reason for the alert trigger (depending on configuration). For quality alerts, reasons can include:
-
the Maximum or Minimum threshold values have been exceeded -
the number of repeated values has been reached or exceeded -
the rate of change has exceeded the defined threshold -
the mean value of the sensor burst has exceeded the defined number of standard deviations from the previous record.
As well as producing an Alert icon, or if the Alert icon function is not active in your configuration, the entire data record will change colour to amber (quality or time warning) or red (timeout warning). Values may also be dashed out, like this - 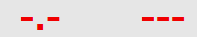 , signifiying that the defined timeout period has been exceeded. |
|
 System Login and Time ControlThe footer of the webpage shows the Login button, current system time and display refresh timer, and a Help button - where the user can find the Quickstart Guide, User Manual and Terms & Conditions.
|
|
Understanding the Footer
In the footer at the base of the screen there are two timer controls.
The first displays the system time as stored by the server. This will be represented in either UTC or a local time zone depending on system configuration.
The second is a count down timer which indicates the number of seconds until the display window is refreshed. When the counter expires the Port-Log database will provide the latest set of sensor records to the web display. Depending on the sample frequency of the sensors, the latest data record may not change with every refresh of the web display.
If the display refresh is successful the updated gauge data will be displayed immediately and the count down counter will reset, otherwise several attempts will be made to re-issue the instruction to the server whilst the count down displays the message "updating...". If a connection is still not established or the database query fails to respond the gauge table will clear and a diagnostics error message will appear, the count down timer will display the message "FAILED". During this time the web page will continue to attempt to reconnect to the server indefinitely and the count down timer will show each attempt with the "updating..." message.
As a precaution against web-browser cache limitations and script performance over extended duration the entire gauge display web page will refresh every 10 minutes.