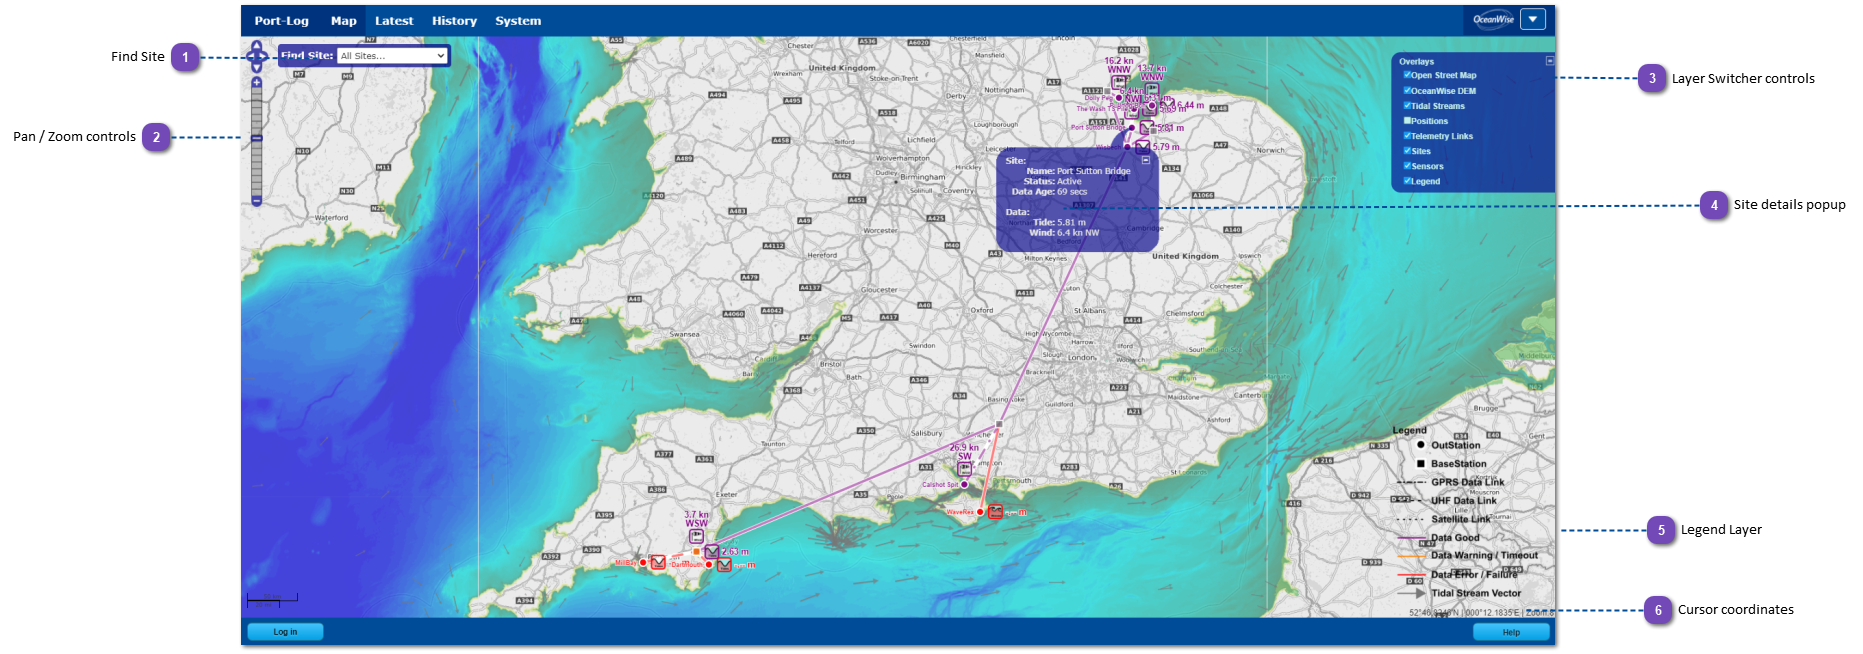
This is the Port-Log system Home-Page which includes a set of web map layers which convey live system status and oceanographic data records.
This page uses the OpenLayers Opensource API to display a series of database produced layers within the web browser.
The ability to view the map display depends on the authentication within the user's Port-Log system. In some cases, a user must be logged in with either "User", "Editor" or "Admin" privileges to view the map display.
Data within the map window are redrawn automatically every 60 seconds, where new data are available.
After loading, the map will appear at full width and is adjusted automatically as the screen resizes.
The main control features of the map are explained in more detail below and indicated on the image at the beginning of this section.
Find Site
Navigate directly to a chosen site. Select the site from the list and the map will centre and zoom onto the location. Select the "All Sites..." option to reset the map zoom and centring.
The map will load at a preset zoom level which contains all the outstations within the client area.
Pan and zoom within the map using the controls at the top left of the map window or simply drag the map with the primary mouse button depressed. Zoom can also be controlled using the mouse scrollwheel if present. Scroll forwards to zoom in, backwards to zoom out.
To zoom in to a specific area, hold down the "SHIFT" key and drag a rectangular box over the area of interest. The map will zoom to the area selected.
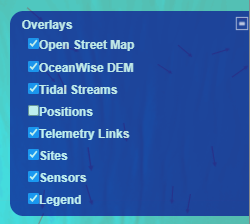
The amount of information shown on the map can be controlled using the layer switcher. By default this is hidden but can be exposed by clicking the + plus button in the top right corner of the map window. The layer switcher also contains the switch to control the legend visibility - which by default is visible in the lower right hand corner of the map.
Open Street Map - An openly sourced terrestrial map. The feed is a Web Map Service (WMS) so an internet connection is required to display data.
OceanWise DEM - This is a higher detailed basemap in the form of an Digital Elevation Model which can be user deactivated if required. This layer shows bathymetry, directly from the OceanWise Ltd. DEM product. The feed is a Web Map Service (WMS) so an internet connection is required to display data. Data scale is controlled automatically so that as a user zooms in higher scale content is loaded. Other data products are available as a WMS (such as Raster Charts, Raster Charts XL, Marine Themes) - please contact OceanWise directly for more information.
Note: This layer may not be available depending on the type of installation in your organisation.
Tidal Streams Layer - This layer loads the latest tidal vectors displays onscreen using a scaled stream vector and labeled with the velocity in kts. This layer can be user deactivated if required. As a dynamic layer loading from the Polatide database this layer is refreshed every 60 seconds and changes will be shown on the map automatically.
Note: This layer may not be available depending on the type of installation in your organisation.
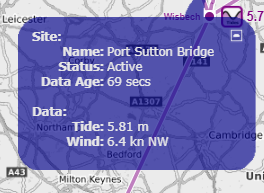
Sites Layer - Displays the locations of the Basestations, Outstations and Control Stations along with their identifiers and status. Outstations are represented by the icons which depict which sensors are deployed. Depending on the number of sensors the icons are arranged differently around a central point which is the . The GPRS data mast (Basestation) is also represented on the sites layer and is located in a virtual position on the map for illustrative purposes. Hover the mouse over any site and a popup bubble will appear showing the latest site status information and observed readings. Click on a site and the latest data page for that site will be loaded. This layer is refreshed automatically every 60 seconds.
Sensors Layer - For each outstation, sensor data will be displayed showing the presence of a pressure "P" or Radar "R" sensor and the current tide reading from that sensor. Where a sensor exists but the tide data is older than 15 minutes the sensor identifier will turn Red and the tide value will not be show.
Note: This layer may not be available depending on the type of installation in your organisation.
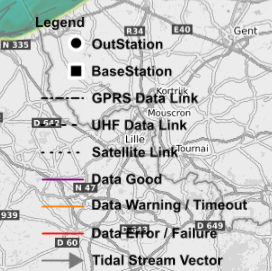
Telemetry Links Layer - This layer demonstrates the path of radio transmissions throughout the system. Radio transmissions can be broken into two types; UHF radio transmissions represented by solid lines and GPRS radio transmissions represented by broken "dashed" lines. The colour of the line indicates the age of the data that last utilised the link according to the ranges indicated on the legend.
This means that if a link between an Outstation and a Basestation has failed the line will be coloured orange/red, however the link between the Basestation and the Control Centre might be receiving data from another outstation so that link will be coloured green. This is a useful tool in diagnosing where a fault in the system has occured.
Legend Layer - This layer controls the display of the legend box at the bottom right hand corner of the map. By default the legend is hidden but can be made visible by checking the legend overlay.
When hovering over an outstation the sensor information and status is displayed in a popup bubble. Click on the outstation icon to go to the latest data series display for the sensor selected.
The coordinates display shows the position of the mouse cursor when over the map. The position is relative to the WGS84 datum in geographic degrees.
The format of the position is expressed as Latitude in degrees followed by decimal minutes, then Longitude in degrees followed by decimal minutes (DD MM.MM). The coordinate pair also displays the hemisphere of the latitude and longitude (N/E/S/W).