Site-specific "Latest" pages are accessed when a site name is mouse-clicked, either from the "Latest" display page or one of the "Dataset" display pages.
Authentication can be enabled at various levels in the system. These pages can be either publicly accessible or hidden behind a login.
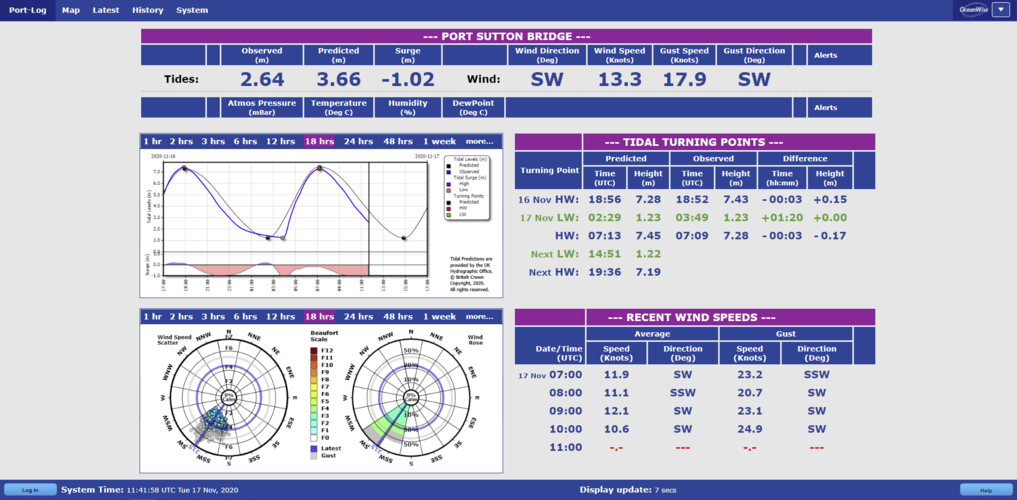
At the top of the page, the latest data record is shown first in a table. The table is named after the site name. An example is shown here:
All datasets pertaining to the site will be displayed. Here, tidal infomation is also displayed as well as meteorological information, and further tidal detail can be found here.
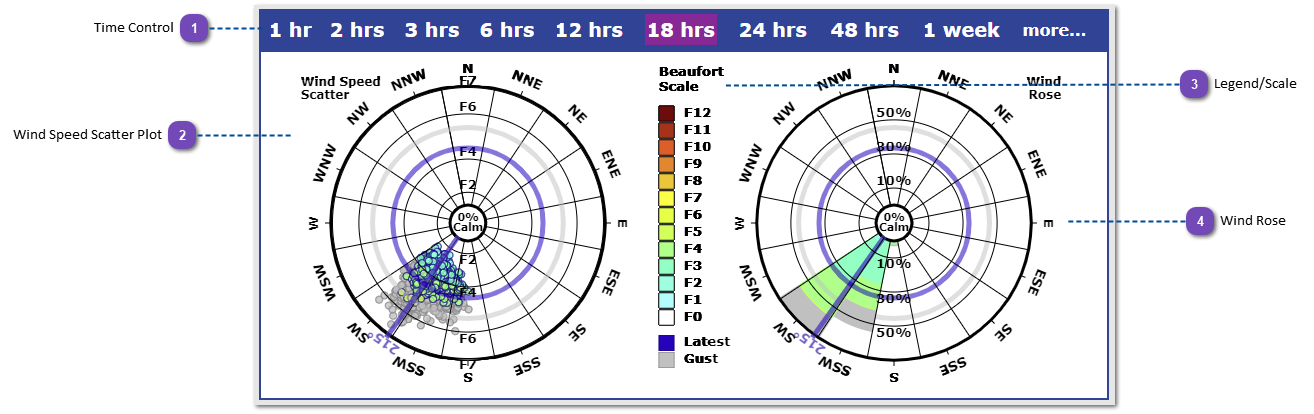
Interactive Met Plots
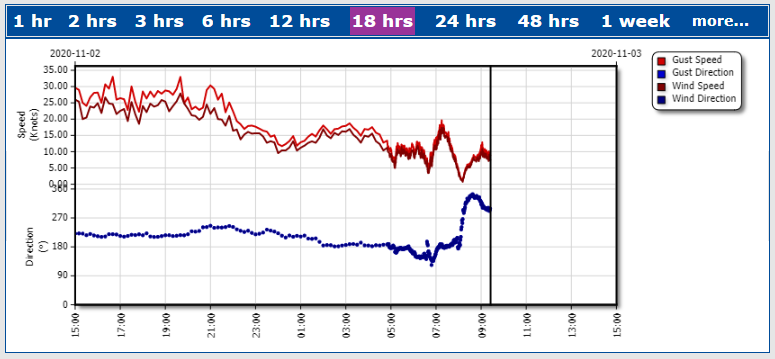
Time Control
With this control bar, the user can select the length of time of interest to populate the timeseries graph- preceeding the current time.
Selecting "more..." takes the user to the "History" page.
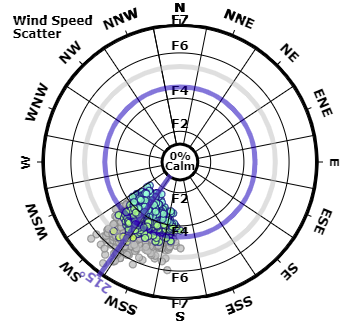
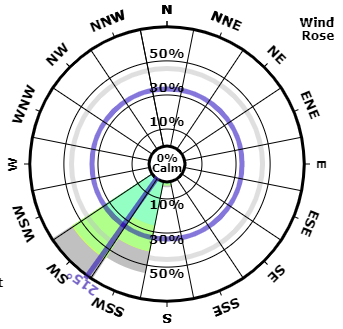
With the wind scatter plot, all data points within the selected time frame are plotted as points, relating to both their direction and speed (converted to Beaufort Scale in this instance). Colour coding (described next) is then used to categorise the points. The average speed and direction are then plotted as a solid line. Clicking on the points within the graph area returns the values associated with the point.
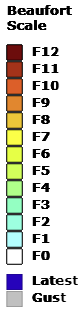
The Beaufort Scale is here colour coded, and can be used as a reference for the wind scatter plot. The Latest and Gust values are also shown at the bottom, and these are also plotted onto the directional plots.
Additionally, time series may be available on the "Meteorological" "Latest" pages -
The time controls at the top of the plot work in the same way as has been previously decribed. Selecting "more..." takes the user to the "History" pages.
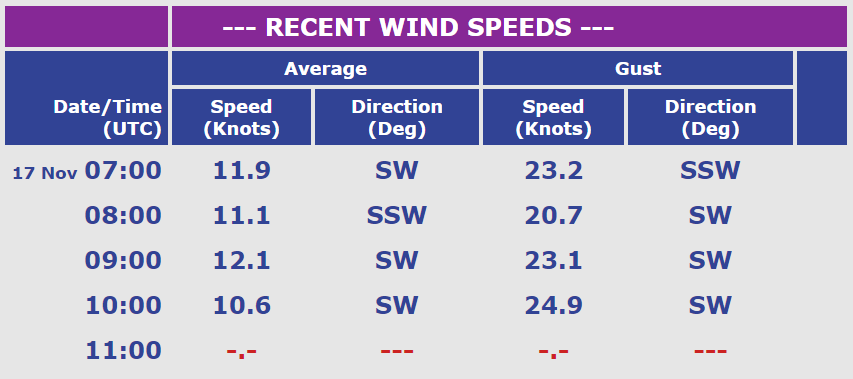
Recent Wind Speeds Table
Where available, there will also be hour-averaged values supplied within a table -
The values stated within the table will be 60-minute averages, based upon the previous 60 minutes data. Values will depend on the configured sampling frequency of the met sensors.