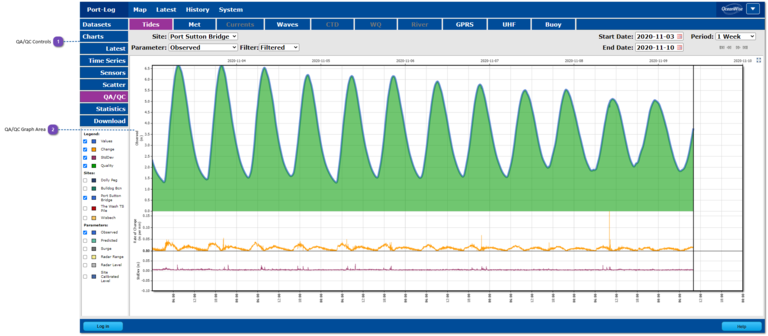
This is an example showing how "QA/QC" data are displayed within the History pages. This page can be utilised to view the filtered, raw or deleted data and their associated QA/QC values (quality, standard deviation), or to test different QA/QC values on the data stored within the Port-Log database.
QA/QC Controls
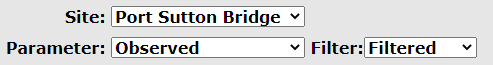
With these drop-down menus, the user can select the Site, Parameter and Filter to apply to the dataset.
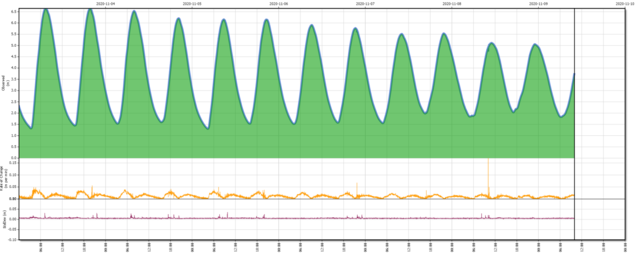
The QA/QC data are drawn in the main window. For graph data like the "QA/QC" data shown here each parameter is plotted as a separate data series on the same graph. Parameters can include data quality (%), standard deviation and rate of change (per minute), and can be made visible/hidden using the interactive Legend to the left of the graph area.