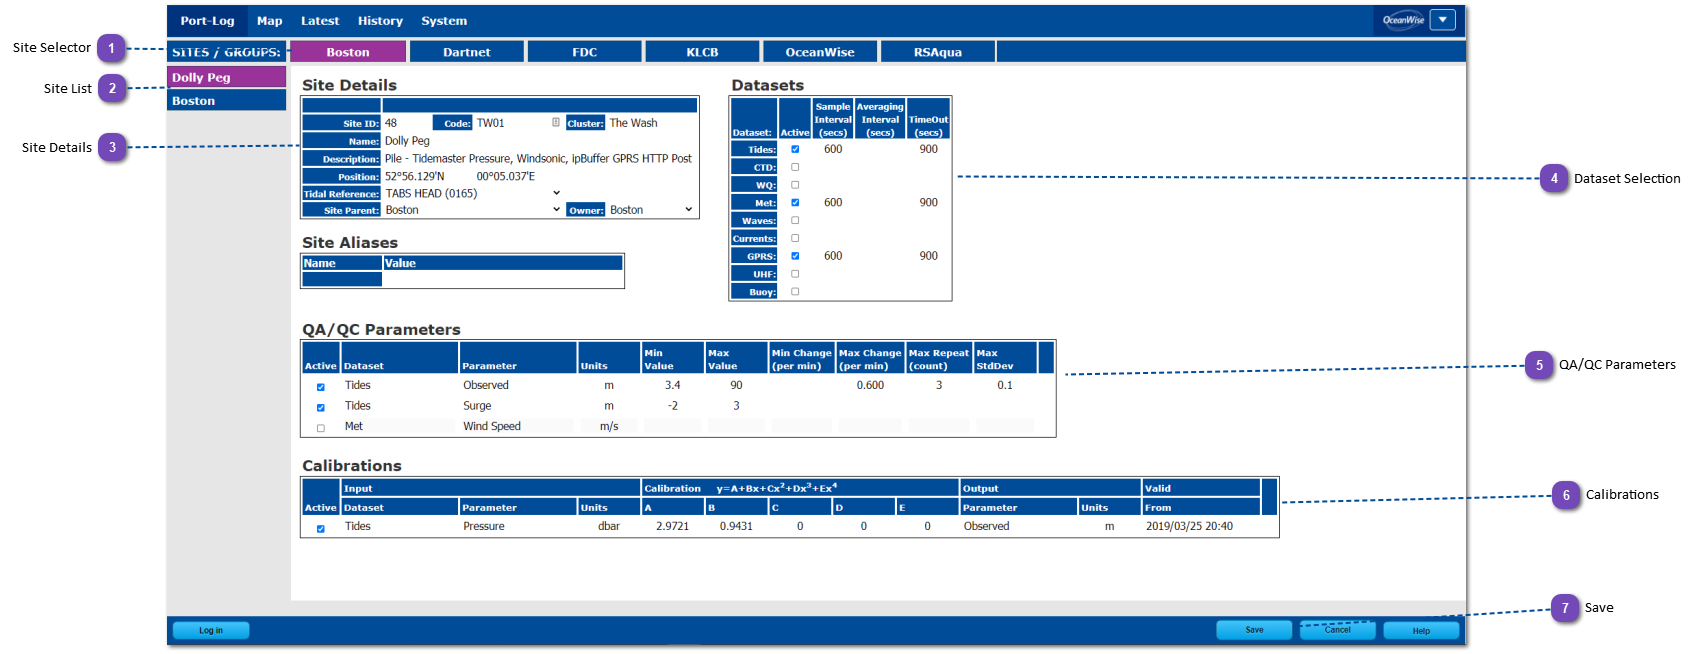
This page provides the functionality to edit sensors, quality parameters and metadata for individual gauges and enclosures. "Admin" privileges are required to make changes on this page.
An important aspect of quality assurance is to create and maintain an appropriate record of equipment installed at each monitoring station or site, and at any intermediate data transmission or base stations. Details that should be maintained include sensor location, elevation, manufacturer, model, serial number, calibration records and firmware version, plus a log of significant events e.g. change in sensor, calibration update.
Location and elevation must be accompanied with details of the Coordinate Reference System (CRS) to which they refer, preferably using the CRS EPSG code to avoid any ambiguity.
Water level readings must include details of the sensor datum or Contact Point and the elevation between this and a local Tide Gauge Benchmark (TGBM) which should be established if not already present. The TGBM should preferably be tied to up to five auxiliary benchmarks, all of which should be resurveyed annually (Ref. IOC TG Manual).
The elevation of any weather stations should be similar recorded to facilitate comparison with other stations and to adjust measurements to a standard level.
Any obstructions or other factors that might affect the measurements should be noted. The direction of an anemometer zero marker, if any, should be noted either as a bearing or transit to suitable conspicuous geographic feature.
Site Selector
Sites can be assigned to a cluster. This has the benefit of grouping the sites by cluster name in the display tables and on the map pages. The selected cluster is highlighted purple. Click on the cluster name to load associated sites and data for that cluster.
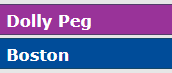
After a cluster has been selected, all sites pertaining to that cluster will be listed vertically, alphabetically. The selected site is highlighted purple.
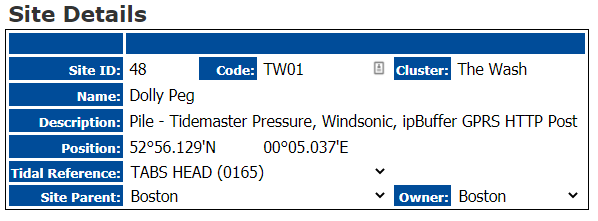
Here, edits can be made to the metadata information of the site, including which Tidal Reference Station to use (tidal height sensors only) and who the direct site parent is.
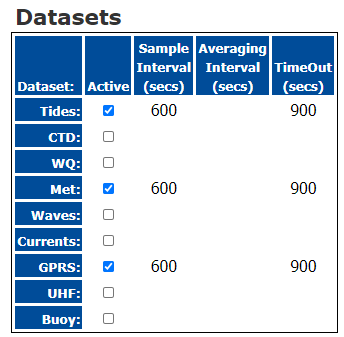
This area allows selection of which datasets a sensor or enclosure is able to supply. Any of the first eight (Tides - UHF) datasets can be selected for use with a sensor.
Buoy here indicates whether a 'Buoy Watch Circle' is active - i.e, an alert will be generated if a moored buoy strays beyond a certain distance threshold away from it's mooring coordinates.
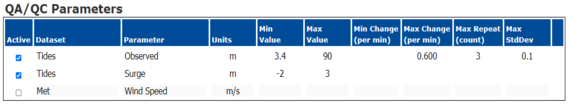
This section allows the user to configure the specifics of the QA/QC thresholds used to remove data records of inadequate quality and display only those that meet the criteria. These values are not deleted however - they are merely removed from the Poert-Log display and remain available within the database.
Minimum Value - If data from the site in question of the parameter chosen is less than this value - it will be flagged in the database and removed from the graphs/gauge displays.
Maximum Value - If data from the site in question of the parameter chosen is greater than this value - it will be flagged in the database and removed from the graphs/gauge displays.
Minimum change - If data from the site in question of the parameter chosen differs by less than this value from the previous record - it will be flagged in the database and removed from the graphs/gauge displays.
Maximum Change - If data from the site in question of the parameter chosen differs by more than this value from the previous record - it will be flagged in the database and removed from the graphs/gauge displays.
Repeat - Can be used in addition to or instead of the minimum change value. If data from the site in question of the parameter chosen does not change for a number of consecutive records - it will be flagged in the database and removed from the graphs/gauge displays.
Maximum StdDev - This measures the range of the data burst gathered in the current record and compares it to the last record. If the range exceeds the number of standard deviations from the value of the previous record - it will be flagged in the database and removed from the graphs/gauge displays.