Site-specific "Latest" pages are accessed when a site name is mouse-clicked, either from the "Latest" display page or one of the "Dataset" display pages.
Authentication can be enabled at various levels in the system. These pages can be either publicly accessible or hidden behind a login.
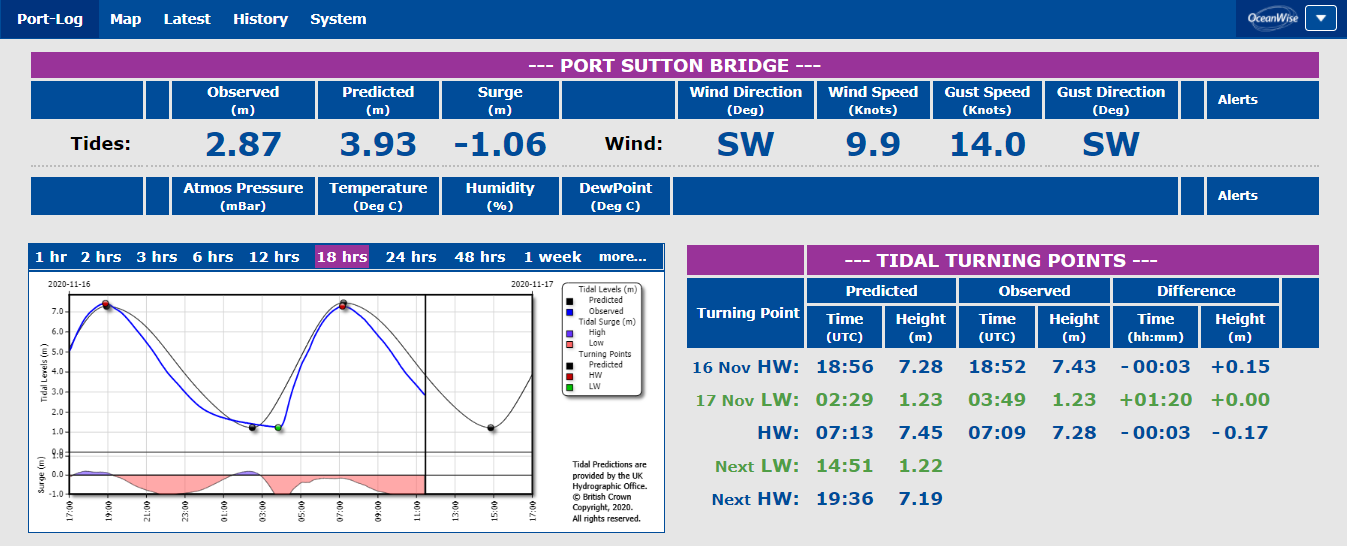
At the top of the page, the latest data record is shown first in a table. The table is named after the site name. An example is shown here:
Below this, any available graphs will be displayed.
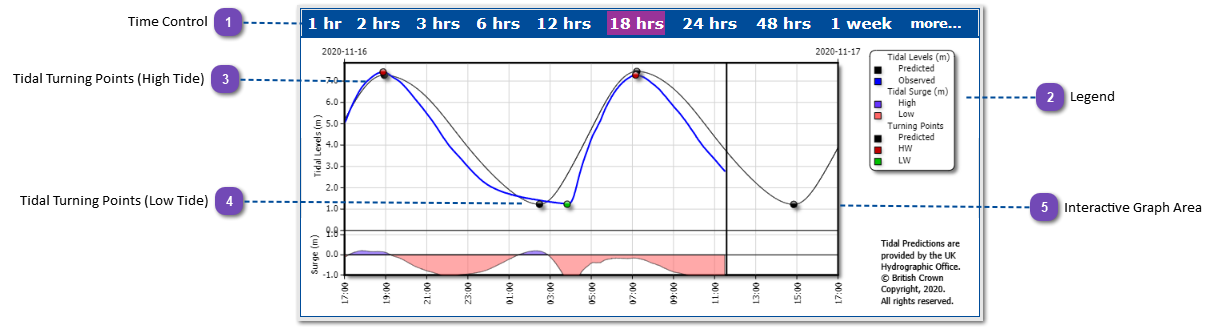
Interactive Tidal Plot
Time Control
With this control bar, the user can select the length of time of interest to populate the timeseries graph- preceeding the current time.
Selecting "more..." takes the user to the "History" page.
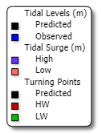
The legend shows all variables plotted within the graph area. In this instance, all paramaters are tide-related, and include the notation used to show the observed and predicted tidal curves, a timeseries of high/low tidal surge, and notation showing the tidal turning points (predicted and observed).
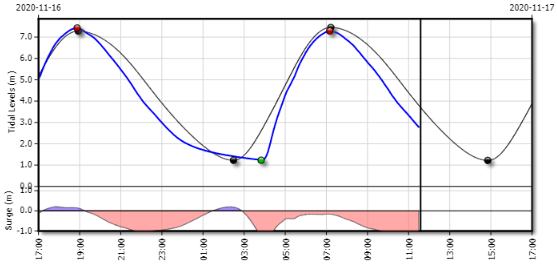
Where changes in the tidal state occur on the observed and predicted series, large markers are placed for indication. High water turning points are indicated with a red marker for observed and a black marker for predicted values.
Where changes in the tidal state occur on the observed and predicted series, large markers are placed for indication. Low water turning points are indicated with a green marker for observed and a black marker for predicted values.
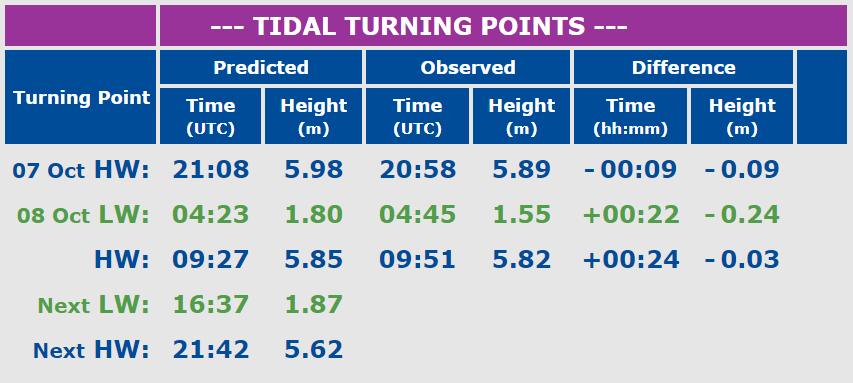
The table displays the predicted and observed turning times and corresponding tidal heights for the previous four changes in tidal state. Additionally the difference in time and height are recorded in a third column. The difference represents the magnitude in time and height in which the observed values differ from the predicted values. For readability data are colour coded so that high water turning points are coloured blue and low water turning points are coloured green.
The data are arranged in chronological order with the oldest turning point first, followed by more recent turning points in order.